Week 31 – PLCO

“Mortality Results from a Randomized Prostate-Cancer Screening Trial”

by the Prostate, Lung, Colorectal, and Ovarian (PLCO) Cancer Screening Trial project team

N Engl J Med. 2009 Mar 26;360(13):1310-9. [free full text]

The use of prostate-specific-antigen (PSA) testing to screen for prostate cancer has been a contentious subject for decades. Prior to the 2009 PLCO trial, there were no high-quality prospective studies of the potential benefit of PSA testing.

The trial enrolled men ages 55-74 (excluded if history of prostate, lung, or colorectal cancer, current cancer treatment, or > 1 PSA test in the past 3 years). Patients were randomized to annual PSA testing for 6 years with annual digital rectal exam (DRE) for 4 years or to usual care. The primary outcome was the prostate-cancer-attributable death rate, and the secondary outcome was the incidence of prostate cancer.

38,343 patients were randomized to the screening group, and 38,350 were randomized to the usual-care group. Baseline characteristics were similar in both groups. Median follow-up duration was 11.5 years. Patients in the screening group were 85% compliant with PSA testing and 86% compliant with DRE. In the usual-care group, 40% of patients received a PSA test within the first year, and 52% received a PSA test by the sixth year. Cumulative DRE rates in the usual-care group were between 40-50%. By seven years, there was no significant difference in rates of death attributable to prostate cancer. There were 50 deaths in the screening group and only 44 in the usual-care group (rate ratio 1.13, 95% CI 0.75 – 1.70). At ten years, there were 92 and 82 deaths in the respective groups (rate ratio 1.11, 95% CI 0.83–1.50). By seven years, there was a higher rate of prostate cancer detection in the screening group. 2820 patients were diagnosed in the screening group, but only 2322 were diagnosed in the usual-care group (rate ratio 1.22, 95% CI 1.16–1.29). By ten years, there were 3452 and 2974 diagnoses in the respective groups (rate ratio 1.17, 95% CI 1.11–1.22). Treatment-related complications (e.g. infection, incontinence, impotence) were not reported in this study.

In summary, yearly PSA screening increased the prostate cancer diagnosis rate but did not impact prostate-cancer mortality when compared to the standard of care. However, there were relatively high rates of PSA testing in the usual-care group (40-50%). The authors cite this finding as a probable major contributor to the lack of mortality difference. Other factors that may have biased to a null result were prior PSA testing and advances in treatments for prostate cancer during the trial. Regarding the former, 44% of men in both groups had already had one or more PSA tests prior to study enrollment. Prior PSA testing likely contributed to selection bias.

PSA screening recommendations prior to this 2009 study:

      • American Urological Association and American Cancer Society – recommended annual PSA and DRE, starting at age 50 if normal risk and earlier in high-risk men
      • National Comprehensive Cancer Network: “a risk-based screening algorithm, including family history, race, and age”
      • 2008 USPSTF Guidelines: insufficient evidence to determine balance between risks/benefits of PSA testing in men younger than 75; recommended against screening in age 75+ (Grade I Recommendation)

The authors of this study conclude that their results “support the validity of the recent [2008] recommendations of the USPSTF, especially against screening all men over the age of 75.”

However, the conclusions of the European Randomized Study of Screening for Prostate Cancer (ERSPC), which was published concurrently with PLCO in NEJM, differed. In ERSPC, PSA was screened every 4 years. The authors found an increased rate of detection of prostate cancer, but, more importantly, they found that screening decreased prostate cancer mortality (adjusted rate ratio 0.80, 95% CI 0.65–0.98, p = 0.04; NNT 1410 men receiving 1.7 screening visits over 9 years). Like PLCO, this study did not report treatment harms that may have been associated with overly zealous diagnosis.

The USPSTF reexamined its PSA guidelines in 2012. Given the lack of mortality benefit in PLCO, the pitiful mortality benefit in ERSPC, and the assumed harm from over-diagnosis and excessive intervention in patients who would ultimately not succumb to prostate cancer, the USPSTF concluded that PSA-based screening for prostate cancer should not be offered (Grade D Recommendation).

In the following years, the pendulum has swung back partially toward screening. In May 2018, the USPSTF released new recommendations that encourage men ages 55-69 to have an informed discussion with their physician about potential benefits and harms of PSA-based screening (Grade C Recommendation). The USPSTF continues to recommend against screening in patients over 70 years old (Grade D).

Screening for prostate cancer remains a complex and controversial topic. Guidelines from the American Cancer Society, American Urological Association, and USPSTF vary, but ultimately all recommend shared decision-making. UpToDate has a nice summary of talking points culled from several sources.

Further Reading/References:
1. 2 Minute Medicine
2. ERSPC @ Wiki Journal Club
3. UpToDate, Screening for Prostate Cancer

Summary by Duncan F. Moore, MD

Image Credit: Otis Brawley, Public Domain, NIH National Cancer Institute Visuals Online
Week 30 – Rifaximin Treatment in Hepatic Encephalopathy

“Rifaximin Treatment in Hepatic Encephalopathy”

N Engl J Med. 2010 Mar25;362(12):1071-81. [free full text]

As we are well aware at Georgetown, hepatic encephalopathy (HE) is highly prevalent among patients with cirrhosis, and admissions for recurrent HE place a significant burden on the medical system. The authors of this study note that HE is thought to result from “the systemic accumulation of gut-derived neurotoxins, especially ammonia, in patients with impaired liver function and portosystemic shunting.” Lactulose is considered the standard of care for the prevention of HE. It is thought to decrease the absorption of ammonia in the gut lumen through its cathartic effects and by alteration of colonic pH. The minimally absorbable oral antibiotic rifaximin is thought to further reduce ammonia production through direct antibacterial effects within the gut lumen. Thus the authors of this pivotal 2010 study sought to determine the additive effect of daily rifaximin prophylaxis in the prevention of HE.

The study enrolled adults with cirrhosis and 2+ episodes of overt HE during the past 6 months and randomized them to treatment with either rifaximin 550mg PO BID x6 months or placebo 550mg PO BID x6 months. The primary outcome was time to first breakthrough episode of HE (West Haven Score of 2+ or West Haven Score 0 –> 1 with worsening asterixis). Secondary outcomes included time to first hospitalization involving HE and adverse events, including those “possibly related to infection.”

299 patients were randomized. 140 and 159 patients were assigned to rifaximin and placebo, respectively. Baseline characteristics were similar among the two groups. Lactulose use prior to and during the study was similar in both groups at approximately 91%. Breakthrough HE occurred in 31 (22.1%) of the rifaximin patients and 73 (45.9%) of the placebo patients [HR 0.42, 95% CI 0.28-0.64, p < 0.001, absolute risk reduction 23.7%, NNT = 4.2]. This result was consistent within all tested subgroups, except patients with MELD score 19-24 and patients who were not using lactulose at baseline. (See Figure 3.) Hospitalization involving HE occurred in 19 (13.6%) of the rifaximin patients and 36 (22.6%) of the placebo patients [HR 0.50, 95% CI 0.29-0.87, p = 0.01, absolute risk reduction 9.1%, NNT = 11.0]. There were no differences in adverse events among the two treatment groups.

Thus, prophylactic rifaximin reduced the incidence of recurrent HE and its resultant hospitalizations. This landmark trial showed a clear treatment benefit with implied savings in healthcare utilization costs associated with HE recurrences and hospitalizations. This marked effect was demonstrated even in the setting of relatively good (91%) lactulose adherence in both treatment arms prior to and throughout the trial.  On the day this trial was published in 2010, the FDA approved rifaximin for “reduction in risk of overt hepatic encephalopathy recurrence” in adults.

Because rifaximin is not generic and remains quite expensive, its financial utility is limited from an insurance company’s perspective. There is no other comparable nonabsorbable antibiotic for this indication. UpToDate suggests starting with lactulose therapy and then adding a nonabsorbable antibiotic, such as rifaximin, both for the treatment of overt HE and for the prevention of recurrent HE. In practice, most insurance companies will require a prior authorization for outpatient rifaximin treatment, but in my recent experience, this process has been perfunctory and easy.

Further Reading/References:
1. ClinicalTrials.gov, NCT00298038
2. FDA, NDA approval letter for Xifaxan (rifaximin)
3. UpToDate, “Hepatic encephalopathy in adults: Treatment”

Summary by Duncan F. Moore, MD

Image Credit: Centers for Disease Control and Prevention / Dr. Edwin P. Ewing, Jr., US Public Domain, via Wikimedia Commons

Week 29 – CHADS2

“Validation of Clinical Classification Schemes for Predicting Stroke”

JAMA. 2001 June 13;285(22):2864-70. [free full text]

Atrial fibrillation is the most common cardiac arrhythmia and affects 1-2% of the overall population with increasing prevalence as people age. Atrial fibrillation also carries substantial morbidity and mortality due to the risk of stroke and thromboembolism although the risk of embolic phenomena varies widely across various subpopulations. In 2001, the only oral anticoagulation options available were warfarin and aspirin, which had relative risk reductions of 62% and 22%, respectively, consistent across these subpopulations. Clinicians felt that high risk patients should be anticoagulated, but the two common classification schemes, AFI and SPAF, were flawed. Patients were often classified as low risk in one scheme and high risk in the other. The schemes were derived retrospectively and were clinically ambiguous. Therefore, in 2001, a group of investigators combined the two existing schemes to create the CHADS2 scheme and applied it to a new data set.

Population (NRAF cohort): Hospitalized Medicare patients ages 65-95 with non-valvular AF not prescribed warfarin at hospital discharge.

Intervention: Determination of CHADS2 score (1 point for recent CHF, hypertension, age ≥ 75, and DM; 2 points for a history of stroke or TIA)

Comparison: AFI and SPAF risk schemes

Measured Outcome: Hospitalization rates for ischemic stroke (per ICD-9 codes from Medicare claims), stratified by CHADS2 / AFI / SPAF scores.

Calculated Outcome: performance of the various schemes, based on c statistic (a measure of predictive accuracy in a binary logistic regression model)

Results:
1733 patients were identified in the NRAF cohort. When compared to the AFI and SPAF trials, these patients tended be older (81 in NRAF vs. 69 in AFI vs. 69 in SPAF), have a higher burden of CHF (56% vs. 22% vs. 21%), are more likely to be female (58% vs. 34% vs. 28%), and have a history of DM (23% vs. 15% vs. 15%) or prior stroke/TIA (25% vs. 17% vs. 8%). The stroke rate was lowest in the group with a CHADS2 = 0 (1.9 per 100 patient years, adjusting for the assumption that aspirin was not taken). The stroke rate increased by a factor of approximately 1.5 for each 1-point increase in the CHADS2 score.

CHADS2 score            NRAF Adjusted Stroke Rate per 100 Patient-Years
0                                      1.9
1                                       2.8
2                                      4.0
3                                      5.9
4                                      8.5
5                                      12.5
6                                      18.2

The CHADS2 scheme had a c statistic of 0.82 compared to 0.68 for the AFI scheme and 0.74 for the SPAF scheme.

Implication/Discussion
The CHADS2 scheme provides clinicians with a scoring system to help guide decision making for anticoagulation in patients with non-valvular AF.

The authors note that the application of the CHADS2 score could be useful in several clinical scenarios. First, it easily identifies patients at low risk of stroke (CHADS2 = 0) for whom anticoagulation with warfarin would probably not provide significant benefit. The authors argue that these patients should merely be offered aspirin. Second, the CHADS2 score could facilitate medication selection based on a patient-specific risk of stroke. Third, the CHADS2 score could help clinicians make decisions regarding anticoagulation in the perioperative setting by evaluating the risk of stroke against the hemorrhagic risk of the procedure. Although the CHADS2 is no longer the preferred risk-stratification scheme, the same concepts are still applicable to the more commonly used CHA2DS2-VASc.

This study had several strengths. First, the cohort was from seven states that represented all geographic regions of the United States. Second, CHADS2 was pre-specified based on previous studies and validated using the NRAF data set. Third, the NRAF data set was obtained from actual patient chart review as opposed to purely from an administrative database. Finally, the NRAF patients were older and sicker than those of the AFI and SPAF cohorts, and thus the CHADS2 appears to be generalizable to the very large demographic of frail, elderly Medicare patients.

As CHADS2 became widely used clinically in the early 2000s, its application to other cohorts generated a large intermediate-risk group (CHADS2 = 1), which was sometimes > 60% of the cohort (though in the NRAF cohort, CHADS2 = 1 accounted for 27% of the cohort). In clinical practice, this intermediate-risk group was to be offered either warfarin or aspirin. Clearly, a clinical-risk predictor that does not provide clear guidance in over 50% of patients needs to be improved. As a result, the CHA2DS2-VASc scoring system was developed from the Birmingham 2009 scheme. When compared head-to-head in registry data, CHA2DS2-VASc more effectively discriminated stroke risk among patients with a baseline CHADS2 score of 0 to 1. Because of this, CHA2DS2-VASc is the recommended risk stratification scheme in the most recent AHA/ACC/HRS guidelines. In modern practice, anticoagulation is unnecessary when CHA2DS2-VASc score = 0, should be considered (vs. antiplatelet or no treatment) when score = 1, and is recommended when score ≥ 2.

Further Reading:
1. 2019 AHA/ACC/HRS Focused Update of the 2014 AHA/ACC/HRS Guideline for the Management of Patients With Atrial Fibrillation
2. CHA2DS2-VASc in Chest (2010)
3. CHADS2 @ 2 Minute Medicine

Summary by Ryan Commins, MD

Image Credit: Alisa Machalek, NIGMS/NIH – National Institute of General Medical Sciences, Public Domain, via Wikimedia Commons

Week 28 – FACT

“Febuxostat Compared with Allopurinol in Patients with Hyperuricemia and Gout”

aka the Febuxostat versus Allopurinol Controlled Trial (FACT)

N Engl J Med. 2005 Dec 8;353(23):2450-61. [free full text]

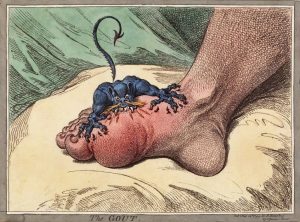
Gout is thought to affect approximately 3% of the US population, and its prevalence appears to be rising. Gout occurs due to precipitation of monosodium urate crystals from supersaturated body fluids. Generally, the limit of solubility is 6.8 mg/dL, but local factors such as temperature, pH, and other solutes can lower this threshold. A critical element in the treatment of gout is the lowering of the serum urate concentration below the limit of solubility, and generally, the accepted target is 6.0 mg/dL. The xanthine oxidase inhibitor allopurinol is the most commonly used urate-lowering pharmacologic therapy. Allopurinol rarely can have severe or life-threatening side effects, particularly among patients with renal impairment. Thus drug companies have sought to bring to market other xanthine oxidase inhibitors such as febuxostat (trade name Uloric). In this chronic and increasingly burdensome disease, a more efficacious drug with fewer exclusion criteria and fewer side effects would be a blockbuster.

The study enrolled adults with gout and a serum urate concentration of ≥ 8.0 mg/dL. Exclusion criteria included serum Cr ≥ 1.5 mg/dL or eGFR < 50 ml/min (due to this being a relative contraindication for allopurinol use) as well as a the presence of various conditions or use of various drugs that would affect urate metabolism and/or clearance of the trial drugs. (Patients already on urate-lowering therapy were given a two week washout period prior to randomization.) Patients were randomized to treatment for 52 weeks with either febuxostat 80mg PO daily, febuxostat 120mg PO daily, or allopurinol 300mg PO daily. Because the initiation of urate-lowering therapy places patients at increased risk of gout flares, patients were placed on prophylaxis with either naproxen 250mg PO BID or colchicine 0.6mg PO daily for the first 8 weeks of the study. The primary endpoint was a serum urate level of < 6.0 mg/dL at weeks 44, 48, and 52. Selected secondary endpoints included percentage reduction in serum urate from baseline at each visit, percentage reduction in area of a selected tophus, and prevalence of acute gout flares weeks requiring treatment.

762 patients were randomized. Baseline characteristics were statistically similar among all three groups. A majority of the patients were white males age 50+ who drank alcohol. Average serum urate was slightly less than 10 mg/dL. The primary endpoint (urate < 6.0 at the last three monthly measurements) was achieved in 53% of patients taking febuxostat 80mg, 62% of patients taking febuxostat 120mg, and 21% of patients taking allopurinol 300mg (p < 0.001 for each febuxostat groups versus allopurinol). Regarding selected secondary endpoints:

1) The percent reduction in serum urate from baseline at the final visit was 44.73 ± 19.10 in the febuxostat 80mg group, 52.52 ± 19.91 in the febuxostat 120mg group, and 32.99 ± 15.33 in the allopurinol 300mg group (p < 0.001 for each febuxostat group versus allopurinol, and p < 0.001 for febuxostat 80mg versus 120mg). 2) The percentage reduction in area of a single selected tophus was assessed in 156 patients who had tophi at baseline. At week 52, the median percentage reduction in tophus area was 83% in febuxostat 80mg patients, 66% in febuxostat 120mg patients, and 50% in allopurinol patients (no statistical difference per authors, p values not reported). Additionally, there was no significant reduction in tophus count in any of the groups. 3) During weeks 1-8 (in which acute gout flare prophylaxis was scheduled), 36% of patients in the febuxostat 120mg sustained a flare, whereas only 22% of the febuxostat 80mg group and 21% of the allopurinol group sustained a flare (p < 0.001 for both pairwise comparisons versus febuxostat 120mg). During weeks 9-52 (in which acute gout flare prophylaxis was no longer scheduled), a similar proportion of patients in each treatment group sustained an acute flare of gout (64% in the febuxostat 80mg group, 70% in the febuxostat 120mg group, and 64% in the allopurinol group). Finally, the incidence of treatment-related adverse events was similar among all three groups (see Table 3). Treatment was most frequently discontinued in the febuxostat 120mg group (98 patients, versus 88 patients in the febuxostat 80mg group and 66 patients in the allopurinol group; p = 0.003 for comparison between febuxostat 120mg and allopurinol).

In summary, this large RCT of urate-lowering therapy among gout patients found that febuxostat, dosed at either 80mg or 120mg PO daily, was more efficacious than allopurinol 300mg in reducing serum urate to below 6.0 mg/dL. Febuxostat was not superior to allopurinol with respect to the tested clinical outcomes of tophus size reduction, tophus count, and acute gout flares. Safety profiles were similar among the three regimens.

The authors note that the incidence of gout flares during and after the prophylaxis phase of the study “calls attention to a well-described paradox with important implications for successful management of gout: the risk of acute gout flares is increased early in the course of urate-lowering treatment” and the authors suggest that there is “a role for more sustained prophylaxis during the initiation of urate-lowering therapy than was provided here” (2458).

A limitation of this study is that its comparator group, allopurinol 300mg PO daily, may not have represented optimal use of the drug. Allopurinol should be uptitrated q2-4 weeks to the minimum dose required to maintain the goal serum urate of < 6.0 mg/dL (< 5.0 if tophi are present). According to UpToDate, “a majority of gout patients require doses of allopurinol exceeding 300 mg/day in order to maintain serum urate < 6.0 mg/dL.” In the United States allopurinol has been approved for doses of up to 800 mg daily. The authors state that “titration of allopurinol would have compromised the blinding of the study” (2459) but this is not true – blinded protocolized titration of study or comparator drugs has been performed in numerous other RCTs and could have been achieved simply at greater cost to and effort from the study sponsor (which happens to be the drug company TAP Pharmaceuticals). The likelihood that such titration would have shifted the results toward a null effect does not go unnoted. Another limitation is the relatively short duration of the trial – follow-up may have been insufficient to establish superiority in clinical outcomes, given the chronic nature of the disease.

In the UK, the National Institute for Health and Care Excellence (NICE), the agency tasked with assessing cost-effectiveness of various medical therapies, recommended as of 2008 that febuxostat be used for the treatment of hyperuricemia in gout “only for people who are intolerant of allopurinol or for whom allopurinol is contraindicated.”

Of note, a recent study funded by Takeda Pharmaceuticals demonstrated the non-inferiority of febuxostat relative to allopurinol with respect to rates of adverse cardiovascular events in patient with gout and major pre-existing cardiovascular conditions.

Allopurinol started at 100mg PO daily and titrated gradually to goal serum urate is the current general practice in the US. However, patients of Chinese, Thai, Korean, or “another ethnicity with similarly increased frequency of HLA-B*5801” should be tested for HLA-B*5801 prior to initiation of allopurinol therapy, as those patients are at increased risk of a severe cutaneous adverse reaction to allopurinol.

Further Reading/References:
1. FACT @ ClinicalTrials.gov
2. UpToDate “Pharmacologic urate-lowering therapy and treatment of tophi in patients with gout”
3. NICE: “Febuxostat for the management of hyperuricemia in people with gout”
4. “Cardiovascular Safety of Febuxostat or Allopurinol in Patients with Gout.” N Engl J Med. 2018 Mar 29;378(13):1200-1210.

Summary by Duncan F. Moore, MD

Image Credit: James Gilray, US Public Domain, via Wikimedia Commons

Week 27 – ELITE-Symphony

“Reduced Exposure to Calcineurin Inhibitors in Renal Transplantation”

by the Efficacy Limiting Toxicity Elimination (ELITE)-Symphony investigators

N Engl J Med. 2007 Dec 20;357(25):2562-75. [free full text]

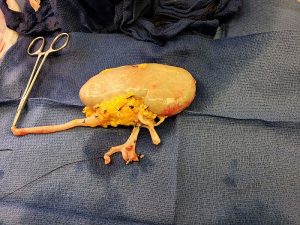
A maintenance immunosuppressive regimen following kidney transplantation must balance the benefit of immune tolerance of the transplanted kidney against the adverse effects of the immunosuppressive regimen. Calcineurin inhibitors, such as cyclosporine (CsA) and tacrolimus, are nephrotoxic and can cause long-term renal dysfunction. They can also cause neurologic and infectious complications. At the time of this study, tacrolimus had been only recently introduced but already was appearing to be better than CsA at preventing acute rejection. Sirolimus, an mTOR inhibitor, is notable for causing delayed wound healing, among other adverse effects. The goal of the ELITE-Symphony study was to directly compare two different dosing regimens of CsA (standard- and low-dose) versus low-dose tacrolimus versus low-dose sirolimus, all while on background mycophenolate mofetil (MMF) and prednisone in order to determine which of these immunosuppressive regimens had the lowest nephrotoxicity, most efficacious prevention of rejection, and fewest other adverse effects.

The trial enrolled adults aged 18-75 scheduled to receive kidney transplants. There was a detailed set of exclusion criteria, including the need for treatment with immunosuppressants outside of the aforementioned regimens, specific poor prognostic factors regarding the allograft match or donor status, and specific comorbid or past medical conditions of the recipients. Patients were randomized open-label to one of four immunosuppressive treatment regimens in addition to MMF 2 gm daily and corticosteroids (“according to practice at the center” but with a pre-specified taper of minimum maintenance doses): 1) standard-dose CsA (target trough 150-300 ng/mL x3 months, then target trough 100-200 ng/mL), 2) daclizumab induction accompanied by low-dose cyclosporine (target trough 50-100 ng/mL), 3) daclizumab induction accompanied by low-dose tacrolimus (target trough 3-7 ng/mL), and 4) daclizumab induction accompanied by low-dose sirolimus (target trough 4-8 ng/mL). The primary endpoint was the eGFR at 12 months after transplantation. Secondary endpoints included acute rejection, incidence of delayed allograft function, and frequency of treatment failure (defined as use of additional immunosuppressive medication, discontinuation of any study medication for > 14 consecutive days or > 30 cumulative days, allograft loss, or death) within the first 12 months.

1645 patients were randomized. There were no significant differences in baseline characteristics among the four treatment groups. At 12 months following transplantation, mean eGFR differed among the four groups (p < 0.001). Low-dose tacrolimus patients had an eGFR of 65.4 ± 27.0 ml/min while standard-dose cyclosporine patients had an eGFR of 57.1 ± 25.1 ml/min (p < 0.001 for pairwise comparison with tacrolimus), low-dose cyclosporine patients had an eGFR of 59.4 ± 25.1 ml/min (p = 0.001 for pairwise comparison with tacrolimus), and low-dose sirolimus patients had an eGFR of 56.7 ± 26.9 ml/min (p < 0.001 for pairwise comparison with tacrolimus). The incidence of biopsy-proven acute rejection (excluding borderline values) at 6 months was only 11.3% in the low-dose tacrolimus group; however it was 24.0% in the standard-dose cyclosporine, 21.9% in the low-dose cyclosporine, and 35.3% in the low-dose sirolimus (p < 0.001 for each pairwise comparison with tacrolimus). Values were similar in magnitude and proportionality at 12-month follow-up. Delayed allograft function (among recipients of a deceased donor kidney) was lowest in the sirolimus group at 21.1% while it was 35.7% in the low-dose tacrolimus group (p = 0.001), 33.6% in the standard-dose cyclosporine group, and 32.4% (p = 0.73 for pairwise comparison with tacrolimus) in the low-dose cyclosporine group (p = 0.51 for pairwise comparison with tacrolimus). Treatment failure occurred in 12.2% of the low-dose tacrolimus group, 22.8% of the standard-dose cyclosporine group (p < 0.001 for pairwise comparison with tacrolimus), 20.1% of the low-dose cyclosporine group (p = 0.003 for pairwise comparison with tacrolimus), and in 35.8% of the low-dose sirolimus group (p < 0.001 for pairwise comparison with tacrolimus). Regarding safety events, the incidence of new-onset diabetes after transplantation (NODAT) at 12 months was highest among the low-dose tacrolimus group at 10.6% but only 6.4% among the standard-dose cyclosporine group, 4.7% among the low-dose cyclosporine group, and 7.8% among the low-dose sirolimus group (p = 0.02 for between-group difference per log-rank test). Opportunistic infections were most common in the standard-dose cyclosporine group at 33% (p = 0.03 for between-group difference per log-rank test).

In summary, the post-kidney transplant immunosuppression maintenance regimen with low-dose tacrolimus was superior to the standard- and low-dose cyclosporine regimens and sirolimus regimens with respect to renal function at 12 months, acute rejection at 6 and 12 months, and treatment failure during follow-up. However, this improved performance came at the cost of a higher rate of new-onset diabetes after transplantation. The findings of this study were integral to the 2009 KDIGO Clinical Practice Guideline for the Care of Kidney Transplant Recipients which recommends maintenance with a calcineurin inhibitor (tacrolimus first-line), and antiproliferative agent (MMF first-line), and corticosteroids (can consider discontinuation within 1 week in the relatively few patients at low immunologic risk for acute rejection, though expert opinion at UpToDate disagrees with this recommendation).

Further Reading/References:
1. ELITE-Symphony @ Wiki Journal Club
2. “The ELITE & the Rest in Kidney Transplantation.” Renal Fellow Network.
3. “HARMONY: Is it safe to withdraw steroids early after kidney transplant?” NephJC
4. 2009 KDIGO Clinical Practice Guideline for the Care of Kidney Transplant Recipients
5. “Maintenance immunosuppressive therapy in kidney transplantation in adults.” UpToDate

Summary by Duncan F. Moore, MD

Image Credit: Rmarlin, CC BY-SA 4.0, via Wikimedia Commons